
The honest verdict on prediction markets vs polls
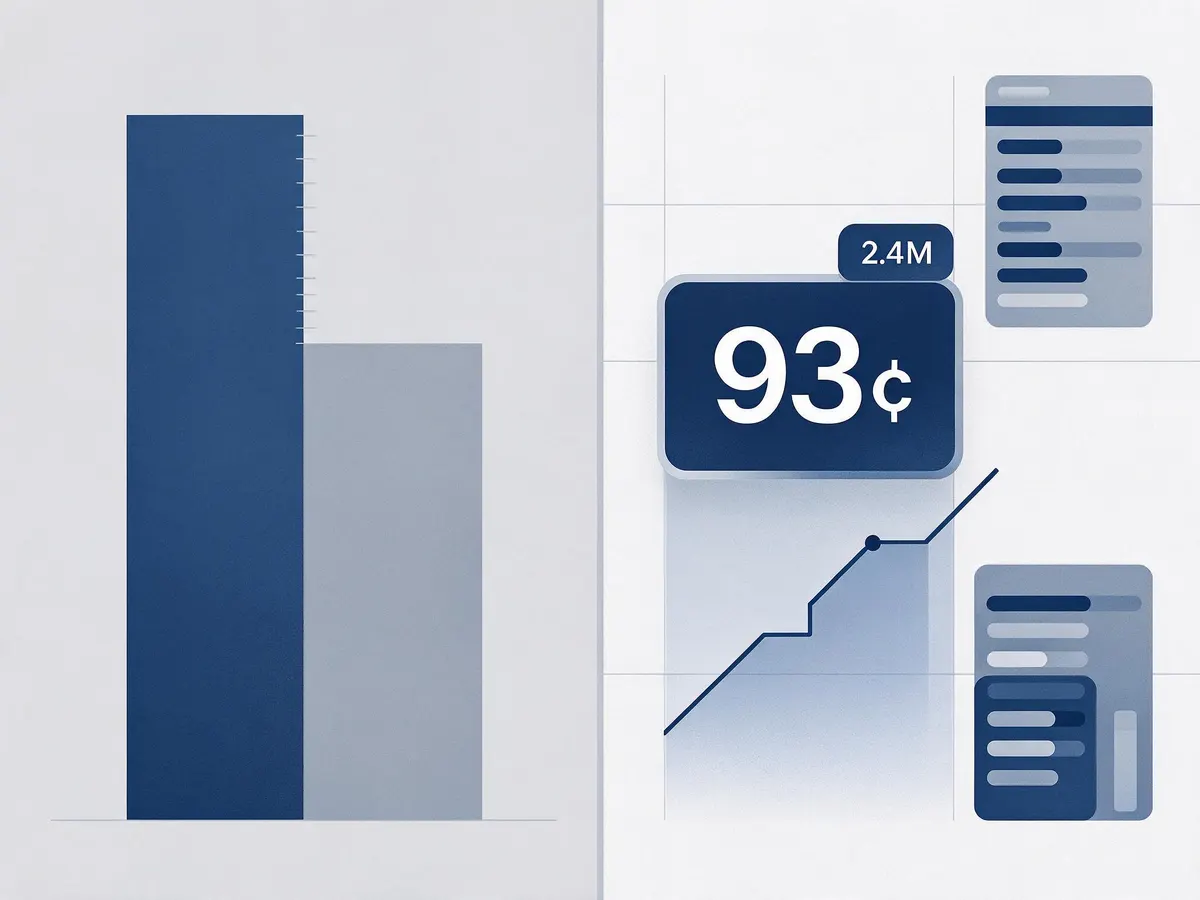
In the first half of October 2026 two numbers sat next to each other on the same screen. The generic congressional ballot had Democrats up by roughly 7 to 8 points: about 7.5 points per DecisionDeskHQ as of 11 October 2026, and around 8 points in the Focaldata/FT series. Prediction markets had Democratic control of the House priced in the low 90s: roughly 90 to 91.5% on Kalshi, and around 93% by some aggregator estimates. Same direction, wildly different units, and a lot of people read them as if they were the same measurement taken twice.
Neither method is reliably more accurate than the other; markets usually hold a small edge on the binary question of who wins a high-attention race, while polls remain the better instrument for measuring how much support exists and when it moves. The claim that markets simply beat polls is stated across the internet with far more confidence than the research supports.
Two readings are defensible here. The first says real money disciplines forecasts: traders absorb every poll, every fundraising report and every candidate stumble, and the resulting price is a cleaner summary than any single survey. The second says markets are mostly just repackaging the polls, adding noise and a layer of trading psychology on top. Having read the evidence, I lean toward the first, but only inside a narrow band: deep, liquid, top-line markets. Outside that band, in thinly traded individual races, I would take a well-built polling average over the market price without much hesitation.
What a 91% price actually is
A prediction market price is the cost of a contract that pays a fixed amount if an event happens and nothing if it doesn’t. On a regulated US event exchange such as Kalshi, a contract on “Democrats win the House” trading at 91 cents means buyers are paying 91 cents for a dollar of payout. That is the market implied probability: 91%.
Why real money sharpens, and distorts, the signal
The mechanism is simple. If you believe the true chance is 80% and the price is 91 cents, you can sell. If enough people agree with you, the price falls. Nobody has to be individually brilliant for this to work; the price aggregates what the participants collectively believe, weighted by how much they are willing to risk. That is the crowd wisdom argument, and it is genuinely different from a survey, because a respondent who is confidently wrong pays no price for it while a trader does.
The distortions are just as real. Prices only correct quickly where there is liquidity. Arbitrage between exchanges keeps headline markets honest, because a visible gap between two venues on the same event invites traders to buy the cheap side and sell the expensive one. In a Senate race with light volume, that gap can sit there for days. Betting markets also show a persistent favourite-longshot bias, with low-probability outcomes trading a little rich. And capital is not free: money locked in a contract until November earns nothing, which nudges heavy favourites slightly below their true probability. A 91 cent price is not a laboratory reading.
Turning odds into probabilities
For exchange-style contracts the conversion is trivial: price in cents equals the percentage. For traditional sportsbook-style decimal odds, divide one by the odds. Decimal 1.25 implies 1 ÷ 1.25 = 80%. Decimal 4.00 implies 25%.
One caveat matters when you compare bookmaker prices to market prices. A bookmaker builds a margin into both sides, so the implied probabilities across a two-way market sum to more than 100%. Add the two sides, then divide each by the total, and you get a cleaner estimate. Exchanges charge fees instead of embedding a spread, which is why their prices read closer to raw probability.
What a poll actually measures
A poll estimates the current opinion of a defined population from a sample of it, then adjusts that sample to resemble the population. It is a snapshot of sentiment now, not a forecast of an outcome later, and that distinction explains most of the apparent disagreement with markets.
Sampling, weighting and the margin of error
A national survey of around 1,000 respondents carries a margin of error of roughly plus or minus three points at 95% confidence, and that figure is the optimistic version. It describes random sampling error only. Weighting by age, education, region, race and past vote, plus the design effects that weighting introduces, widens the real uncertainty beyond the number printed in the press release. A margin of error says nothing at all about sample bias, which is the error that actually ruins election polls: if the people who refuse to answer differ systematically from those who do, no amount of weighting fixes it.
Likely voter models: the biggest judgment call in polling
Turning a sample of adults into a forecast of an electorate requires a likely voter model, and this is where two honest pollsters can produce different headline numbers from near-identical raw data. Screening on self-reported enthusiasm, past participation or registration status can shift a margin by several points. In midterms, where turnout runs well below presidential years and differential enthusiasm decides seats, the model choice often matters more than the sampling.
Why the two numbers disagree even when they agree
A D+7 to D+8 generic ballot and a price somewhere between 90 and 93% are not in conflict. One is a national vote margin among respondents today; the other is a probability that a specific institutional outcome occurs after a seat-by-seat contest in which districts, candidate quality and turnout all intervene. A seven to eight point generic ballot lead that held to election day would almost certainly flip the House, so a very high probability is a reasonable translation, not a contradiction.
Genuine divergence comes from four places. Timing: polls record sentiment now, markets price the outcome then, including expected movement. Participant pools: a poll samples the electorate, a market samples people with money and opinions, which is not a representative group and never claims to be. Independence: survey respondents answer without seeing each other, while traders watch the same price and can herd behind it. And information scope: markets trade on things no poll asks about, from candidate withdrawals to legal rulings to redistricting.
The 2026 midterms as a test case
House control is the cleanest comparison available this cycle. The generic ballot sits near D+7 to D+8 and market prices sit in the low 90s, roughly 90 to 93% depending on the venue you read, and both have been pointing the same way. If you want a single number for “will the House flip,” the market price is the more directly useful one, because it already contains the polls plus the structural knowledge that a seven to eight point national lead does not distribute itself evenly across 435 districts.
Senate and individual swing state races are where I would stop trusting the price. Senate control turns on a handful of competitive states, and markets for single states draw a fraction of the volume of the national contract. Thin volume means wide spreads, slow correction and prices that can be moved by one motivated participant. You will also find different exchanges quoting noticeably different probabilities on the same state race, which is itself the tell: when arbitrage has not closed the gap, the price is not yet a consensus. For those races, read the polling average and treat the market as a sanity check rather than the other way round.
What 2020 and 2024 actually showed
The research record is split, and anyone who tells you otherwise is selling something. The Iowa Electronic Markets beat the matching poll in roughly 74% of comparisons across five presidential elections, which is the headline result market advocates lean on. Against it, a 2012 review by political scientists Robert Erikson and Christopher Wlezien examined decades of election markets and concluded that once scientific polling matured in the 1930s, markets stopped adding any predictive edge over polls at all.
2024 did not settle it. A 2025 analysis led by economist Rajiv Sethi found that Polymarket’s national forecast for the popular vote and the Electoral College landed about in line with standard statistical models, not meaningfully ahead of them. The same work found markets performed considerably worse than the models down the ballot, particularly on Congressional races where volume and public attention are thinner. That is the single most important finding for anyone looking at 2026, because the midterms are entirely a down-ballot event.
Where markets clearly won in 2024 was speed. Prices moved within hours of real-world events while polling averages took days to absorb the same news, for the mechanical reason that a poll has to be fielded before it can be published. Polls, meanwhile, retain the thing markets cannot provide: a measurement of who is moving and why, broken out by group.
One figure deserves scepticism rather than repetition. Across 2024 election markets, one platform resolved about 93% of its contracts correctly while another landed closer to 67%. That looks damning until you ask which contracts each venue listed. A platform offering mostly safe, lopsided markets will score well on this metric without forecasting anything hard. Resolution accuracy is not calibration, and nobody has published a clean calibration comparison across exchanges.
| Question | Better answered by polls | Better answered by markets |
|---|---|---|
| Who is most likely to win? | No | Yes, in liquid markets |
| By how much? | Yes | No |
| Which voter groups are shifting? | Yes | No |
| How fast does news get priced in? | Days | Hours |
| Low-attention down-ballot races | Yes | No |
| Quantified uncertainty | Margin of error, understated | Implied probability, fee and bias adjusted |
The part still unresolved
What nobody can yet tell you is whether the market edge on top-line races survives the arrival of mass retail participation on regulated US exchanges. The Iowa Electronic Markets result came from a small, capped, largely academic trading pool. A high-volume consumer exchange is a different animal, and whether more money means better calibration or more herding behind whatever the price already says is an open empirical question that 2026 will partly answer.
For now, the workable habit is to read both and refuse to collapse them. Use the polling average to understand the shape of the electorate and the market price as a probability estimate on a specific binary outcome, discounting that price where volume is thin. If the two tell you the same story, as they currently do on House control, your confidence should rise. If they diverge sharply in a quiet Senate race, the likeliest explanation is not that the market knows something, it is that nobody has bothered to trade it.
A note on participation: event contracts are financial products that can lose their full value, availability and legality vary by jurisdiction, and they are restricted to adults. Nothing here is betting or investment advice, and if staking money on outcomes stops feeling like a considered decision, use the deposit limits and self-exclusion tools your platform provides.